As more people shop online, businesses have a lot of information to deal with. However, the real problem is being able to use this information well and find important ideas from it. This is exactly why data visualization is so important.
Ecommerce data visualization helps businesses understand the needs of their customers and improve their sales. It also makes shopping better for customers by giving them what they want. This post will explain what data visualization is, why it’s important for ecommerce, and the different types of ecommerce data that can be visualized.
What is Data Visualization?
Data visualization means showing data using pictures like charts, graphs, or maps. It gives businesses the ability to quickly understand complicated sets of data, find patterns, and make smart choices. In ecommerce, data visualization is important for understanding the huge amount of information available.

This involves turning information about sales, customer behavior, website visits, stock levels, and marketing results into easy-to-understand pictures. When ecommerce businesses look at this data, they can see trends and patterns, which helps them make smart decisions and plan for the future.
It helps people understand information better, makes it easier to communicate, and helps businesses improve how they do things. In the end, it is very important for making the online shopping experience better for customers and helping businesses grow and work more efficiently.
Importance of Data in Ecommerce
Ecommerce data is valuable for businesses, like finding gold. It provides really helpful information about ecommerce customer experience, market trends, inventory control, and more. Ecommerce solutions providers leverage data visualization techniques to identify trends and opportunities, enhancing SEO strategies for improved online visibility and sales.

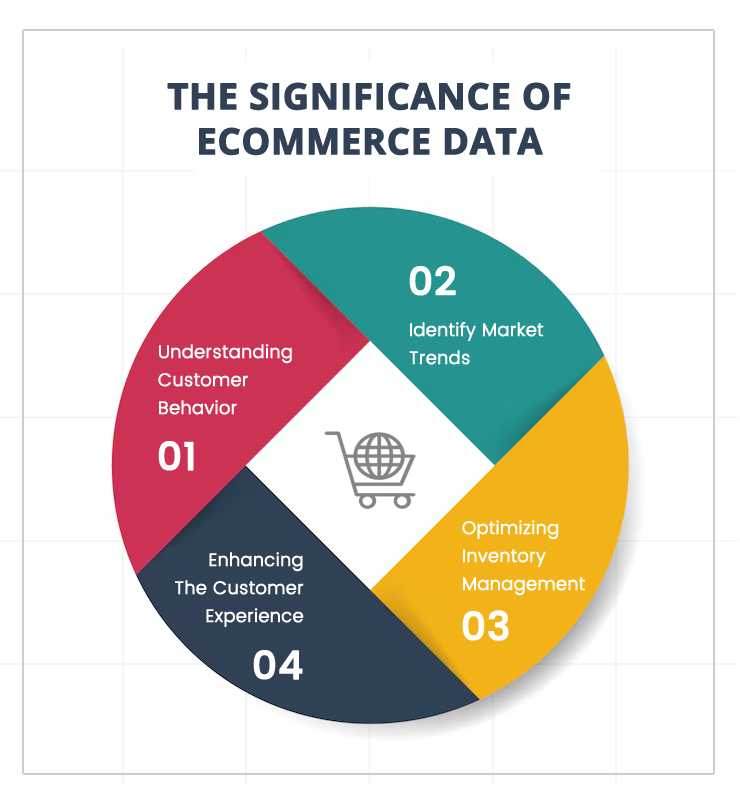
When used well, this information helps businesses stay ahead of the competition and achieve success by making decisions based on data. Ecommerce Data visualization helps businesses in the following ways:
Understanding Customer Behavior
When businesses look at what customers buy, what they look at online, and their personal information, they can understand what customers want and like better. This knowledge helps improve a successful marketing plan, make customer experiences more personal, and in the end increase sales.
Understanding Market Trends
Seeing information in a visual way helps us to quickly analyze what customers want and what is happening in the market. Businesses can use pictures and graphs of their sales information to see which products are popular, find areas where they can sell more, and predict new trends. This will help them improve their products and stay ahead of other companies.
Also Read: Headless eCommerce: Advantages for Online Stores
Managing Inventory Better
Using data visualization, companies can track how much inventory they have, check what stock is available, and identify any problems in the supply chain. Seeing information about how much stock is available, how long it takes to receive new stock, and when to order more stock makes inventory management easier. It also helps to avoid running out of stock and reduces the costs of keeping inventory.
Improving Customer Experience
Seeing data about what customers think, their reviews of products, and their interactions with customer service helps companies find problems in the customer experience. With this knowledge, they can make the customer experience better, make customers happier, and keep them coming back.
Different Types of Ecommerce Data to be Visualized
Sales Data
Sales data tells us important information about the number of items sold and the money made from online transactions. This information includes different measures like how much money was made, how many things were sold, how much people usually spend, and how much it costs to get a new customer.
By studying sales numbers, businesses can learn more about what customers like to buy and how they like to shop. They can find out which products sell the most, understand what’s popular, and see if marketing is working well.
Sales data helps businesses make better decisions about how much to charge for their products, predict how much customers will want, and manage their inventory better. By looking at the numbers from their sales, online businesses can find important information that helps them make better decisions and grow.
Competitor Analysis
Studying competitors in ecommerce means looking at what they do, how well they do it, and how they are seen in the market. This helps a business figure out how to improve its own strategy and be more competitive.
This process involves collecting and studying information about what other companies are selling, how much they are charging, how they are advertising, how they interact with customers, and how they are doing in the market overall.
By looking at what other businesses are doing, online stores can find new trends, see where there are opportunities to stand out, and take advantage of chances to grow. It helps businesses see how they are doing compared to others in the same industry. It also helps them figure out what they need to work on and make their plans better.
Voice of Customer Data
Customer feedback and reviews about products, services, and shopping experiences are called Voice of Customer (VoC) data in ecommerce. Businesses collect and study VoC data from places like customer reviews, surveys, social media, and support interactions to learn how to make their products better and make their customers happier.
VoC data helps online businesses see what’s popular and what needs to be better in their products and services. Businesses can do a better job of meeting customer needs and improving relationships by listening to what customers have to say. This can help them make their marketing efforts more effective.
Website Analytics
Website analytics includes keeping track of, measuring, and studying different numbers that show how well an online store is doing and how people are using it. These measures include how many people visit the website, what they do on it, how many people make a purchase, how many people leave the website quickly, and more.
Ecommerce companies can use tools like Google Analytics (GA4) to understand how people use their website. They can see which pages are popular and where people stop using the website. They can make changes to the design, content, and user experience to make it more engaging and increase sales.
They can also see how well their ads are working, figure out where people are coming from, and measure the effect of website changes. By keeping track of website data, businesses can make smart choices to improve their online presence, make more sales, and get the most out of their investments.
Stock Availability Data
Stock availability data means knowing if a product is in stock or not at an online store. This information tells us how much of each item is available to buy, where the items are stored, and if they are currently in stock or not.
By keeping an eye on how much stock they have, online stores can make sure they have enough products to satisfy customers. They can also avoid having too much stock, which uses up money and space in their warehouse.
It is used to make plans like changing prices, managing backorders, and predicting demand to make sure they have the right amount of inventory and sell as much as possible. It also helps businesses give customers accurate information, which reduces the chances of canceling orders and makes customers happier.
Shipping and Fulfillment Data
Shipping and fulfillment data is the information about getting orders to customers and handling the logistics. This information has things like how the package is delivered, when it will arrive, the cost, and what the customer wants.
Companies can look at how well the shipping is going and find ways to make it better and save money. This includes checking how long it takes for the delivery, how much it costs to ship, and how well the shipping company is doing.
Also, by using shipping and order completion information, businesses can give customers better info about when their deliveries will arrive, keep them updated on where their orders are at all times, and offer different choices for shipping, which makes them happier.
Product Performance
Product performance includes sales, money made, how many people buy compared to how many see the product, what customers think, scores, and how many times people look at the product page.
Understanding how well products are selling helps businesses figure out which ones are the most popular, what customers like, and what the current trends are. It helps them decide which products to focus on, how to set prices, and where to put their money for the most profit.
This information about how well a product does can help companies find out which products are not doing well, understand why they are not selling or making customers unhappy, and then make changes to make the product better or improve how they sell it.
Also Read: 15 Best eCommerce CMS Platforms for Small and Medium Businesses
Customer Acquisition Channels
Customer acquisition channels are the ways that businesses use to get new customers. These channels are organic search, paid ads, social media, email marketing, affiliate marketing, influencer partnerships, and others.
With this info online businesses can figure out how well their marketing is working and decide where to put their money to get the most out of it. Knowing how customers find your business helps you figure out which ways bring in the most people, sales, and money.
It helps them make their ads better, find the right people to show them to, and spend money on the best places to make more sales. By using information from how they get customers, online stores can make their marketing better, reach the right people, and grow their business in a competitive online market.
Best Practices for Data Visualization in Ecommerce
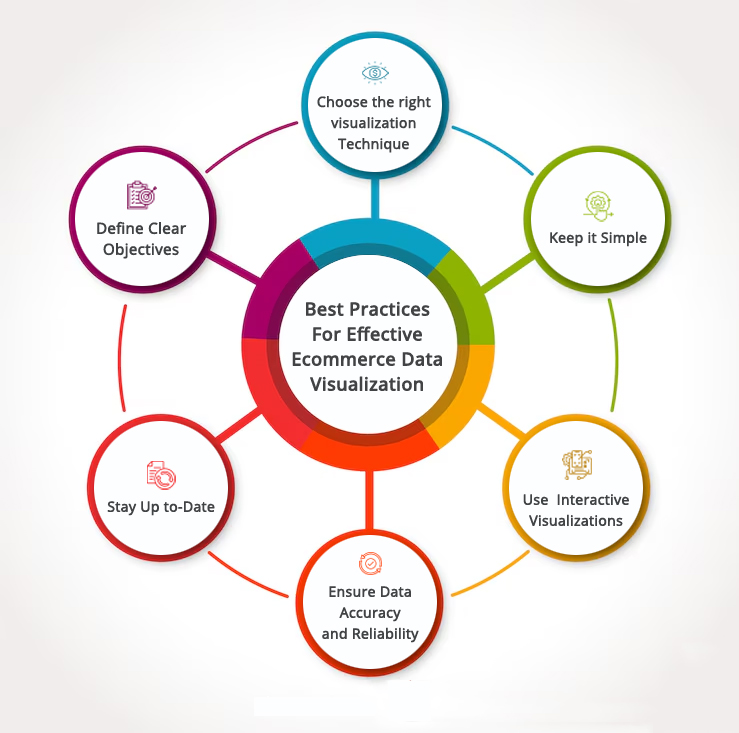
In order to solve these problems and make the most of ecommerce data visualization, businesses should follow these helpful tips:

- Have a clear goal: Before starting to visualize data, businesses should decide on what they want to achieve and figure out what important questions they need to answer by analyzing the data. This makes sure that the images show useful information.
- Pick the right technique: Businesses need to choose the best way to show their data, such as line graphs, bar charts, or scatter plots, depending on the type of data and what they want to find out. Using presentation tools makes it easier for people to understand information and helps to make business communication more effective.
- Make it simpler: Data visuals should be simple, clear, and easy to understand. Don’t put too much unnecessary stuff or too many numbers in the visuals. Keep it simple. Focus on pointing out important ideas and patterns.
- Use interactive visualizations: Interactive pictures help people to explore information and to be fully involved in what they are looking at. Use zoom, filter, and drill-down tools to help you look at the data in more detail.
- Have correct and reliable data: Accurate data is very important for showing data in a useful way. Businesses need to make sure their data is accurate and clean before they show it. It’s very important to regularly check the data and make sure it’s good quality.
- Be updated: Online shopping data is always changing, with new information being created often. Businesses need to make sure that the pictures and graphs they use to show their data are current, so that customers can learn from the latest information.
Data Visualization Challenges
Although data visualization is very helpful, it also brings some difficulties that online businesses need to deal with. Here are some common obstacles:
Accuracy and Quality of Data
The effectiveness of data visualization depends on having accurate and good quality data. Businesses need to make sure their data is trustworthy so they can make good decisions using visualized data. Checking that the data is correct and trustworthy is very important because there is so much of it coming from different places.
Online businesses need to fix problems with the accuracy of their data to make sure their graphs and charts are trustworthy. Using strong methods to check the accuracy of data, cleaning the data properly, and following rules for managing the data are important steps to overcome these problems.
Integration of Data
Online businesses usually keep their information in systems like enterprise resource planning, marketing automation platforms, and customer relationship management for growth. Combining information from different places can be complex, and may require special tools or platforms to do it.
Online businesses regularly gather information from various places like sales sites, advertising platforms, customer interactions, and other apps. Combining all these different data sets into one format for viewing can be difficult and takes a lot of time.
Challenges come from different data formats, systems that don’t work together, and different levels of detail in the data. To tackle these problems, you need strong tools to combine data, like data warehouses, ETL processes, and API integrations.
Complexity of Data
Ecommerce information can be very detailed and large in amount. Understanding and showing big and complicated sets of information needs special techniques and tools for visualizing data.
Online businesses have lots of different information, like who their customers are, what they buy, how they use their website, how much stock they have, and how well they are selling. Managing and understanding this complicated data can be overwhelming, especially when thinking about all the different factors and relationships involved.
To solve these problems, we need tools that can analyze big sets of data in different ways and show the results in a helpful way. By handling data well, online businesses can learn important things and make smart decisions to stay ahead of their competition.
Privacy and Security of Data
Online stores have to protect their customers’ private information by using strong security measures. It’s very important to follow the rules about protecting data and to have strong security systems.
Investing in ecommerce solutions will assist businesses in creating, handling, and keeping B2B/B2C commerce engines at every digital contact point. It is also important to teach your data-handling teams about the advantages of VPN and help them understand the different kinds of fraud that can affect businesses and customers in this field.
This includes when someone takes control of your account to steal from you, and it happens a lot when there’s a lot of activity. It’s about keeping customers safe and making sure the company looks good.
To Conclude
Data visualization is a powerful tool for online businesses. It helps them understand and use information from large amounts of data. By using charts and graphs to show how much they’re selling, who’s buying their products, how many people visit their website, and how much stock they have, companies can better understand how their business is doing and what customers want.
However, businesses need to overcome problems like making sure the data is correct, putting different sets of data together, dealing with complicated information, and keeping the data safe in order to use data visualization effectively. By following the best ways of doing things and keeping up with new information, companies can use ecommerce data visualization to make their online businesses even better.
FAQs
Why is it important to have data visualization for ecommerce?
Displaying data visually in ecommerce is really important for businesses to understand and use the information to make decisions. By showing information in pictures, it helps people understand it better and lets them see patterns and connections that they might not notice just by looking at the numbers.
What kind of information can be visualized in online shopping?
Ecommerce data visualization means showing different kinds of data such as how many products are sold, who is buying it, how many people are visiting the website, how much product is in stock, and how well the marketing is working, and also the feedback of the customers.
What tools are usually used to visualize data in ecommerce?
Many tools are used to visualize data like Tableau, Power BI, Google Data Studio, Domo, and Adobe Analytics. These platforms have strong features for making interactive displays, reports, and visualizations. This helps businesses look at and understand their data better.
How can ecommerce stores use data visualization to help them?
Ecommerce stores can get a lot of help from using pictures and graphs to show their information. By learning more about how they sell things, how customers act, and what’s popular, companies can find ways to grow, make marketing better, handle inventory better, and make everything work smoother.


