Skip to content
In today’s data-driven world, companies generate vast amounts of information. Once businesses understand how to harness diverse data sources, collecting, processing, and storing become paramount. Subsequently, data analysis takes center stage. The techniques employed for big data analysis often hinge upon its intended use and the nature of the data itself.
Increasingly, visual data representation is viewed as a best practice. Data visualization illuminates patterns, provides situational awareness, and prompts action in the face of anomalies. A multitude of tools currently available facilitates this understanding.
Elastic Kibana stands out as a widely favored tool, streamlining data comprehension. As an open-source offering, it is both free and universally accessible, enabling swift and effective data visualization and analysis. In this post, we delve into what is Kibana, simplifying data representation and highlighting its pivotal features.
What is Kibana?
Kibana is an exploration tool for information housed in Elasticsearch Clusters. It grants users the ability to visualize this data. Elastic, the company behind Kibana, also offers two other complimentary tools: Elasticsearch and Logstash.
While Elasticsearch serves as a database for assorted documents and data, Logstash accumulates, processes, and archives logs for future reference. Predominantly, Kibana’s function revolves around data discovery and analysis.
Moreover, Kibana showcases data in various forms, from heat maps and line graphs to pie charts and geolocation maps. This versatility aids users in pinpointing the root cause of issues within Elasticsearch data. With Kibana, vast data volumes become comprehensible, and creating dynamic dashboards that reflect real-time Elasticsearch updates is a breeze.
A cloud development company harnesses the power of Kibana for insightful data visualizations. With Kibana, they transform raw data into meaningful insights for optimized solutions.
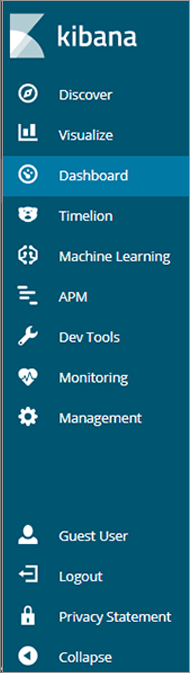
Features of Elastic Kibana
Discover
The Discover page offers interactive data exploration, allowing users to access each field and set their desired timeframe. Its user-friendly interface, combined with a powerful search capability, multiple filtering options, and visual data displays, enhances the Elasticsearch experience.
Visualize

Kibana empowers users to graphically represent data stored in Elasticsearch. From data tables, pie charts, and line graphs to geolocation maps, time series, and markdown visualizations, users can integrate various formats into their dashboards.

Dashboards
This page displays a collection of visualizations and search results. The Kibana dashboard is highly adaptable and can be modified with ease. For example, you can efficiently sift through data and expand the dashboard to a full-screen view.
The dashboard’s customization options allow you to adjust its size, position, and content. Additionally, you can save your configurations and share the dashboard with others.
Timelion
Timelion presents time series data in an intuitive language, aiming to consolidate various data sources into one central location. It offers a unified platform for querying, visualizing, and transforming data. Users can effortlessly generate dynamic and interactive visuals using data that evolves over time. As a component of Kibana, Timelion facilitates the exploration of time-dependent data and trends, boasting a user-friendly syntax and engaging interactive capabilities.
Machine Learning
Detecting cyber-attacks, infrastructural issues, and business challenges can be intricate due to the complexity and multifaceted nature of datasets. Nevertheless, Kibana’s machine learning feature is engineered to identify anomalies and oversee their resolutions. This capability mimics the behavior of Elasticsearch data, recognizing patterns and trends, thereby expediting problem detection and minimizing false alerts.
APM
The Application Performance Monitoring system empowers users to monitor their applications and services. It collates comprehensive data regarding application performance and potential errors. This enables developers to gauge the efficacy of their apps and promptly identify performance bottlenecks.
Also Read: How Much Does it Cost to Make an App in 2024: Understanding Cost Factors
Dev Tools
Kibana’s tools streamline interactions with the Elastic Stack. A notable feature is the Console, which assists developers in inputting Elasticsearch commands in one tab and visualizing the outputs in another. Alongside the Console, tools such as the Grok Debugger and Search Profiler allow for precise application customization to meet individual needs.
Monitoring
Kibana’s monitoring page serves three primary functions:
- Real-time visualization of information from Elasticsearch, Kibana, Logstash, and Beats via the Elastic Stack.
- Historical performance analysis of these products.
- Active monitoring of Kibana, with the capability to relay data to the monitoring cluster.
Management
Kibana’s management page is dedicated to configuring its operational settings, encompassing:
- The index pattern, crucial for the initial setup and ongoing index naming configurations.
- Saved objects, the repository for storing items such as visualizations, dashboards, and searches for future access.
- Advanced settings, providing options to tweak Kibana’s functionalities.
In essence, whether the goal is to implement security measures, integrate data sources, or manage pipelines, Kibana offers a comprehensive interface to accomplish these tasks.
Also Read: What is a Framework in Programming: The Key to Efficient Coding
Uses of Kibana
For those unfamiliar with this data analytics and visualization platform, here’s a concise breakdown of the features that Kibana offers:
Interactive Charts
Kibana provides intuitive charts and reports that facilitate the exploration of extensive log data. Users can effortlessly zoom in and out on particular data subsets, shift time frames, and delve deep into reports. The interactive elements of these charts simplify data examination, leading to more profound insights.
Aggregations and Filters
These are built-in tools designed to classify and streamline data. By merely clicking a few times, these features enable users to conduct various analyses, such as identifying top items, crafting charts, and discerning patterns. Aggregations encapsulate and decipher vast data sets, while filters pinpoint specific data for visualization. Together, they assist users in dissecting data and crafting lucid visual designs within Kibana.
Anomaly Detection

This refers to the identification of unusual or outlier patterns that deviate from standard behavior. As previously highlighted, Kibana’s Anomaly Detection, powered by machine learning, aids in uncovering these irregularities, streamlining data analysis and facilitating informed decisions.
Collaboration and Sharing
Kibana ensures the secure sharing of visualizations and dashboards. It incorporates features to restrict access, safeguarding against potential data breaches. Users can present their insights, images, and charts to colleagues, superiors, or clients, ensuring a consistent view within Kibana. Additionally, the “Dashboard Only Mode” in Kibana permits the creation of users with constrained access and visibility.
Graph
This feature assists in visualizing data points and discerning connections between them. It harnesses a robust tool known as the graphical exploration API to explore and encapsulate data in the Elasticsearch index. This allows users to identify vital links, patterns, and relationships through dynamic visual graphs, invaluable for comprehending network interdependencies, system relationships, and data-driven influences.
Kibana Search

Kibana offers versatile ways to search within log data. It’s a potent tool that facilitates the exploration and analysis of data within Elasticsearch, delivering a straightforward system to locate, organize, and display data. This instrument is essential for extracting meaningful information from extensive data sets, enabling the analysis of logs, security assessments, and business intelligence comprehension.
Mapping Support

Kibana’s unique features allow users to seamlessly visualize geographical data on maps. The Elastic Maps service in Kibana displays these maps by utilizing shape files, basemap tiles, and other critical features for geospatial data visualization. A recent enhancement to the data layer now offers an expanded view of countries on the region maps within Kibana.
Canvas
Canvas, an application within Kibana, allows for an innovative data presentation. Rashid Khan, the creator of Kibana, envisions Canvas as a space where live data can be adorned with elements such as logos, text, shapes, and colors to create a distinctive brand impression. It excels in visual storytelling and information representation, making sharing and interacting with data within Kibana more intuitive.
Watcher UI
With the refreshed aesthetics of Kibana 6, users can now create and modify alerts based on specific criteria. This feature proactively evaluates the alert thresholds, offering visual indicators and predictive recommendations. Additionally, it facilitates the dispatch of alert notifications via email, logs, or slack, complemented with specific template details.
Reporting

Kibana boasts a robust reporting feature that facilitates the effortless generation of visualization or dashboard reports. Users can define the timing of report creation, retrieve it on-demand, or have it triggered under specified conditions. Reports can be easily generated through an HTTP POST request and shared with collaborators.
Final Thoughts
Kibana has emerged as an indispensable tool in the realm of data visualization and comprehension. It empowers individuals and teams to gain deeper insights into their data, offering user-friendly interfaces, vivid data representations, and seamless integration with Elasticsearch. Whether for system log analysis, security event monitoring, or business report generation, Kibana transforms raw data into actionable insights.
Its adaptability across varied applications further cements its value. From seasoned professionals to novices, Kibana facilitates data exploration in a comprehensible manner. In an era where data-driven decision-making reigns supreme, Kibana enlightens users, fostering informed decisions and novel data-driven innovations. In this overview, we’ve elucidated Kibana’s capabilities and standout features, underscoring its position as a premier data visualization tool.
FAQs
What are the uses of Kibana?
Kibana is a complimentary tool designed to simplify data visualization and comprehension. It’s tailored to synchronize perfectly with Elasticsearch. Its primary objective is to enable users to search, analyze, and visually represent their data, aiding in the extraction of critical insights, system monitoring, and interactive dashboard creation.
How do Kibana and Elasticsearch collaborate?
Kibana and Elasticsearch are symbiotic, with Elasticsearch housing the data that Kibana visualizes. Kibana leverages Elasticsearch’s advanced search and data organization capabilities, empowering users to create visuals and dashboards based on Elasticsearch data.
What types of data can Kibana visualize?
Kibana can represent a plethora of data types, ranging from system logs, application performance metrics, and security events, to business metrics. Its adaptability supports a wide array of applications and objectives.
Is Kibana accessible to those without technical expertise?
Absolutely! Kibana is designed to be user-centric, catering to both technical experts and those without extensive technical knowledge. While it houses advanced features for tech-savvy users, its intuitive interface also accommodates individuals without a technical background, enabling them to craft visualizations and dashboards effortlessly.